Tutorial: Authenticating from TOPCat outside the Science Platform#
This tutorial shows you how to access the Rubin Science Platform datasets from outside the Science Platform with user tokens. This example specifically shows how to access table data from the Science Platform’s TAP service with TOPCAT, a popular viewer and editor for tabular and catalog data.
Follow the steps in Creating user tokens to create a new user token. Ensure that the token has
read:tapscope.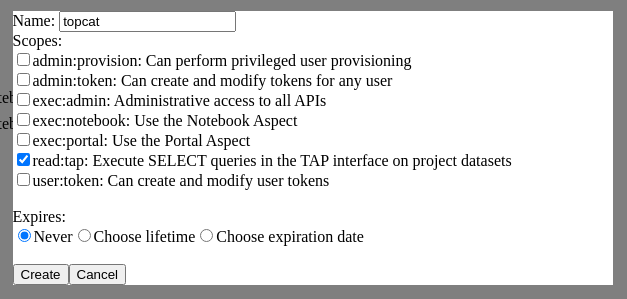
Be sure to copy the token string shown after you click Create. The Science Platform won’t show you the token string again after you dismiss the dialog.
On your local machine open up TOPCAT. This will require having Java installed.
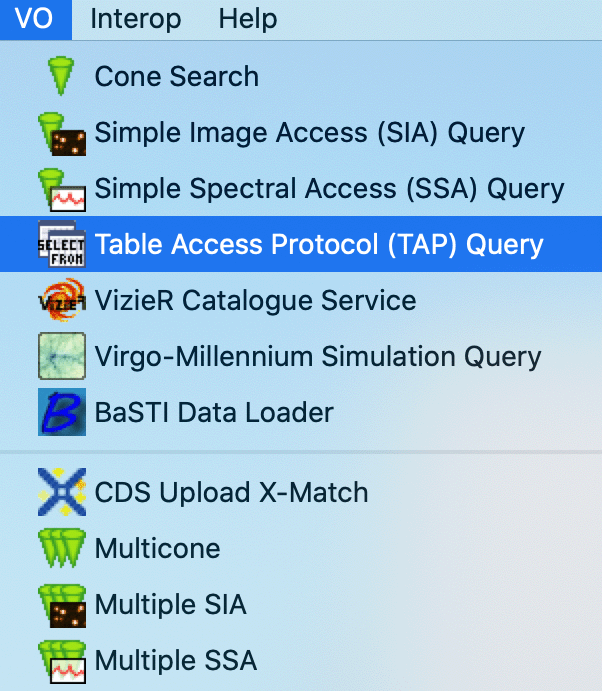
From TOPCAT, select .
This will bring up a window with a list of available TAP services. We want to use a service with a known endpoint. Enter
https://data.lsst.cloud/api/tap/in the box at the bottom of the page labeled TAP URL.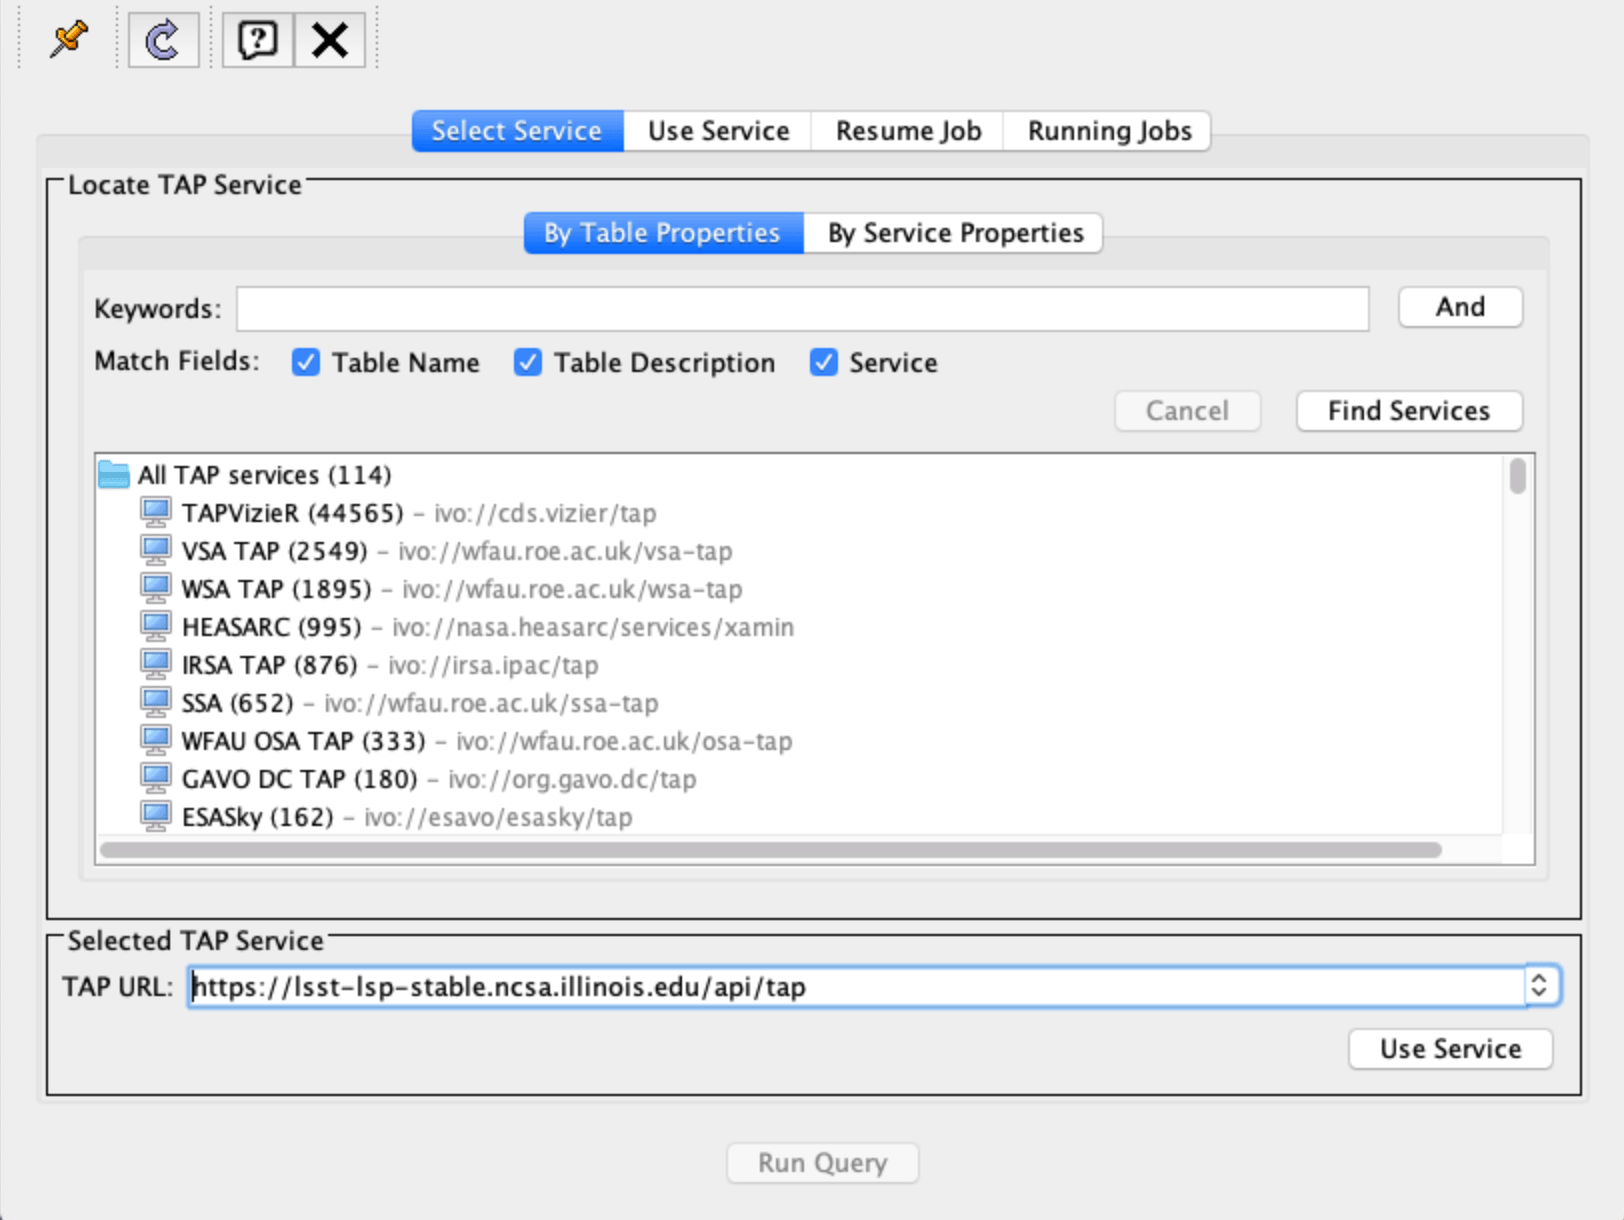
Clicking Use Service will bring up a username/password dialog. Set the User to
x-oauth-basic. Paste the entire access token into the Password field.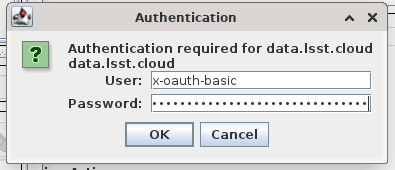
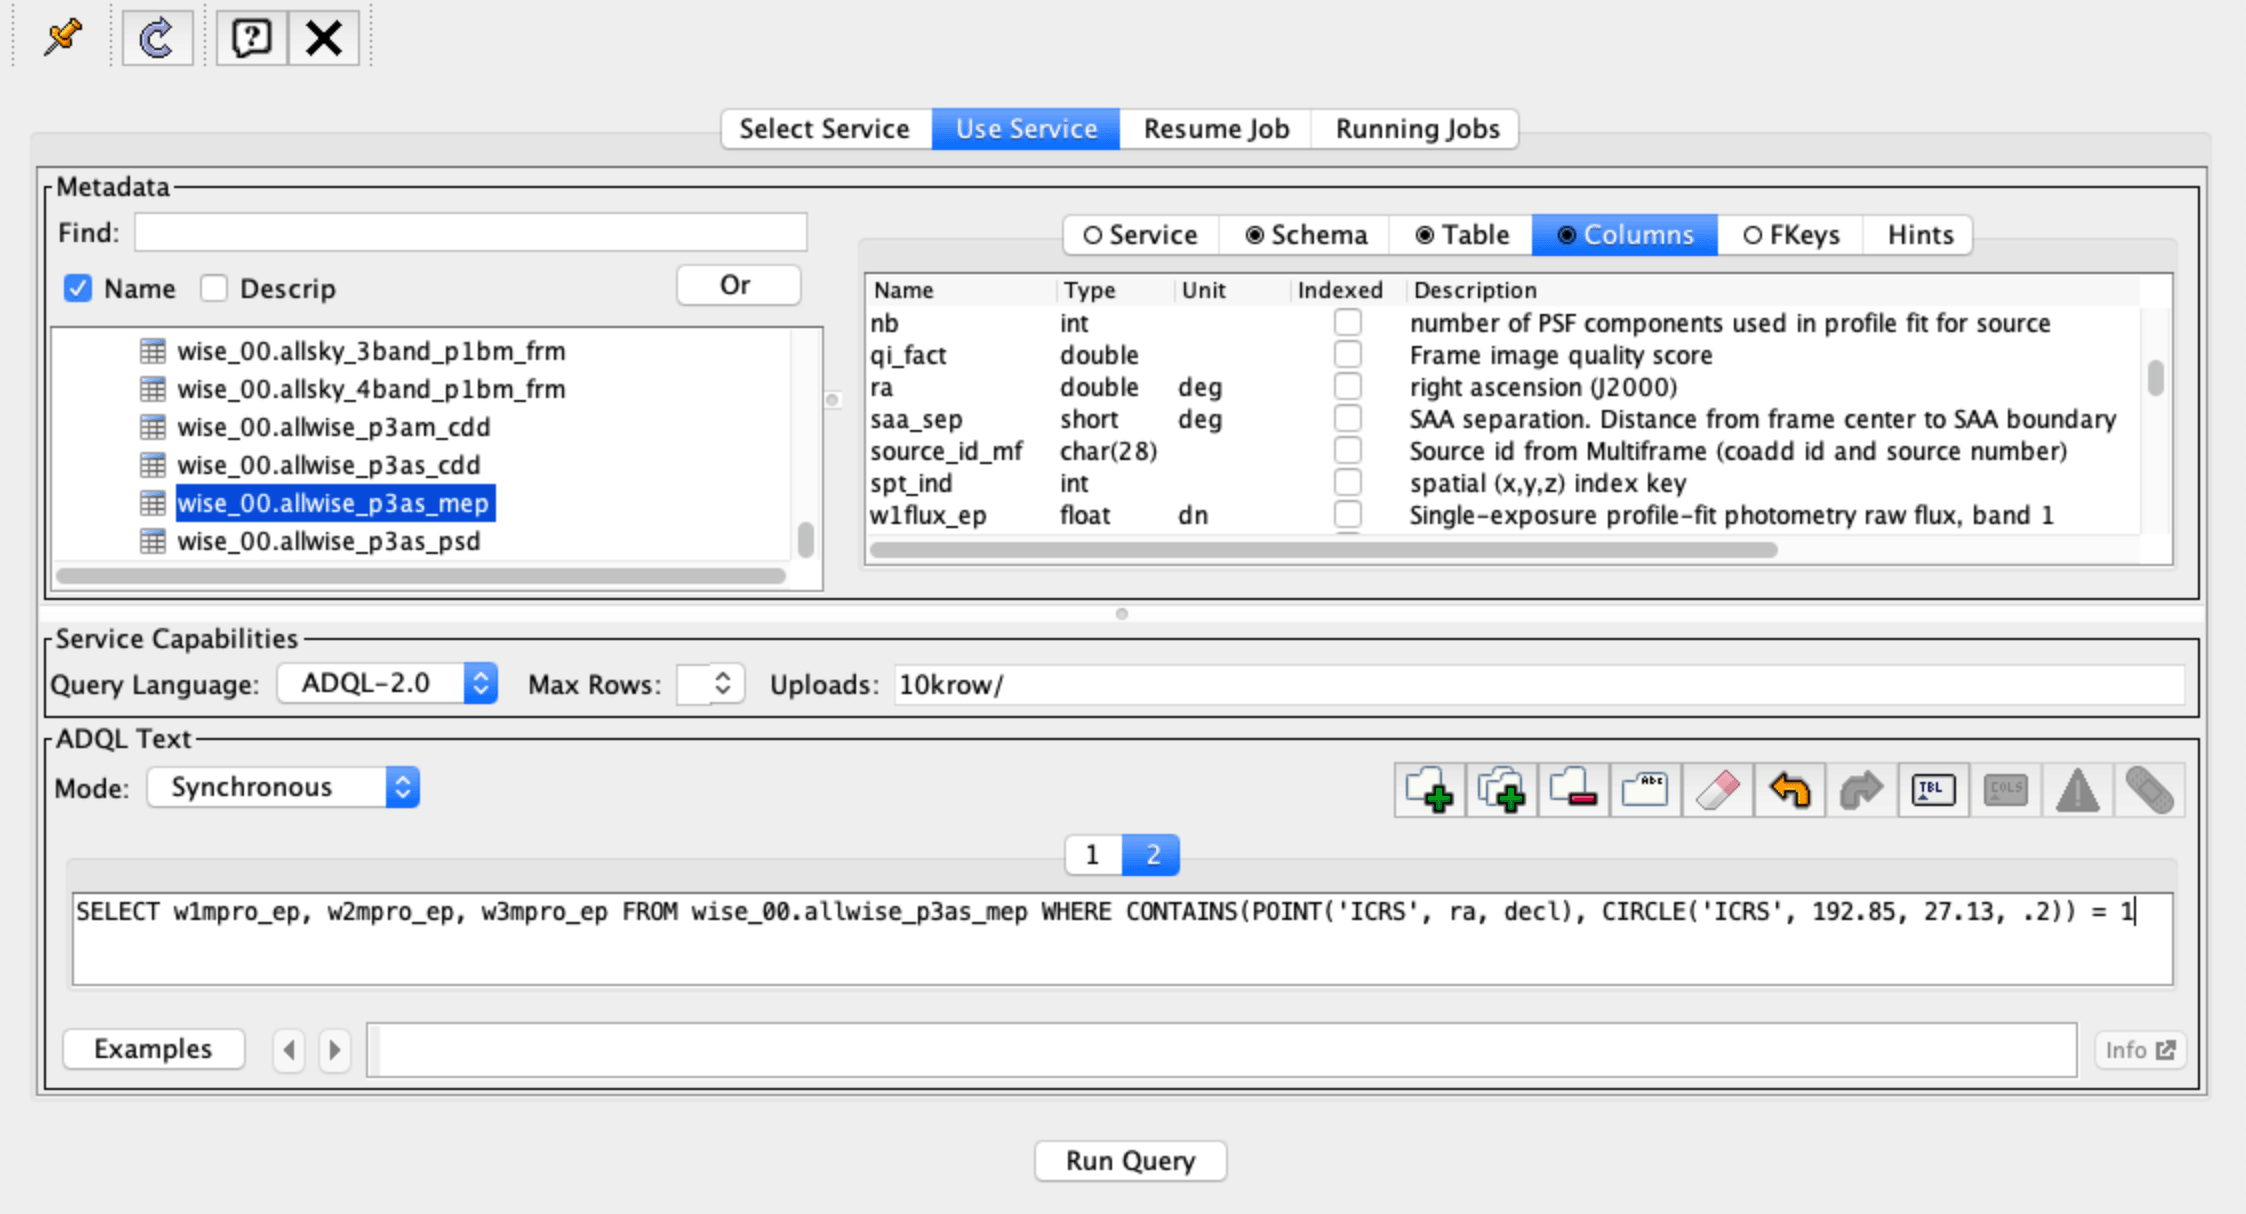
If authentication is successful, the window will change to the TAP service window and information about the various tables in the service will appear in the left portion of the upper panes. If you select a table, you will see information about the columns in the table to the right of the table listing.
This example uses the
wise_00.allwise_p3as_meptable. Make a query by entering the ADQL in the box at the bottom and click the Run Query button.The example query selects three magnitudes from a circular region on the sky.
SELECT w1mpro_ep, w2mpro_ep, w3mpro_ep FROM wise_00.allwise_p3as_mep WHERE CONTAINS(POINT('ICRS', ra, decl), CIRCLE('ICRS', 192.85, 27.13, .2)) = 1
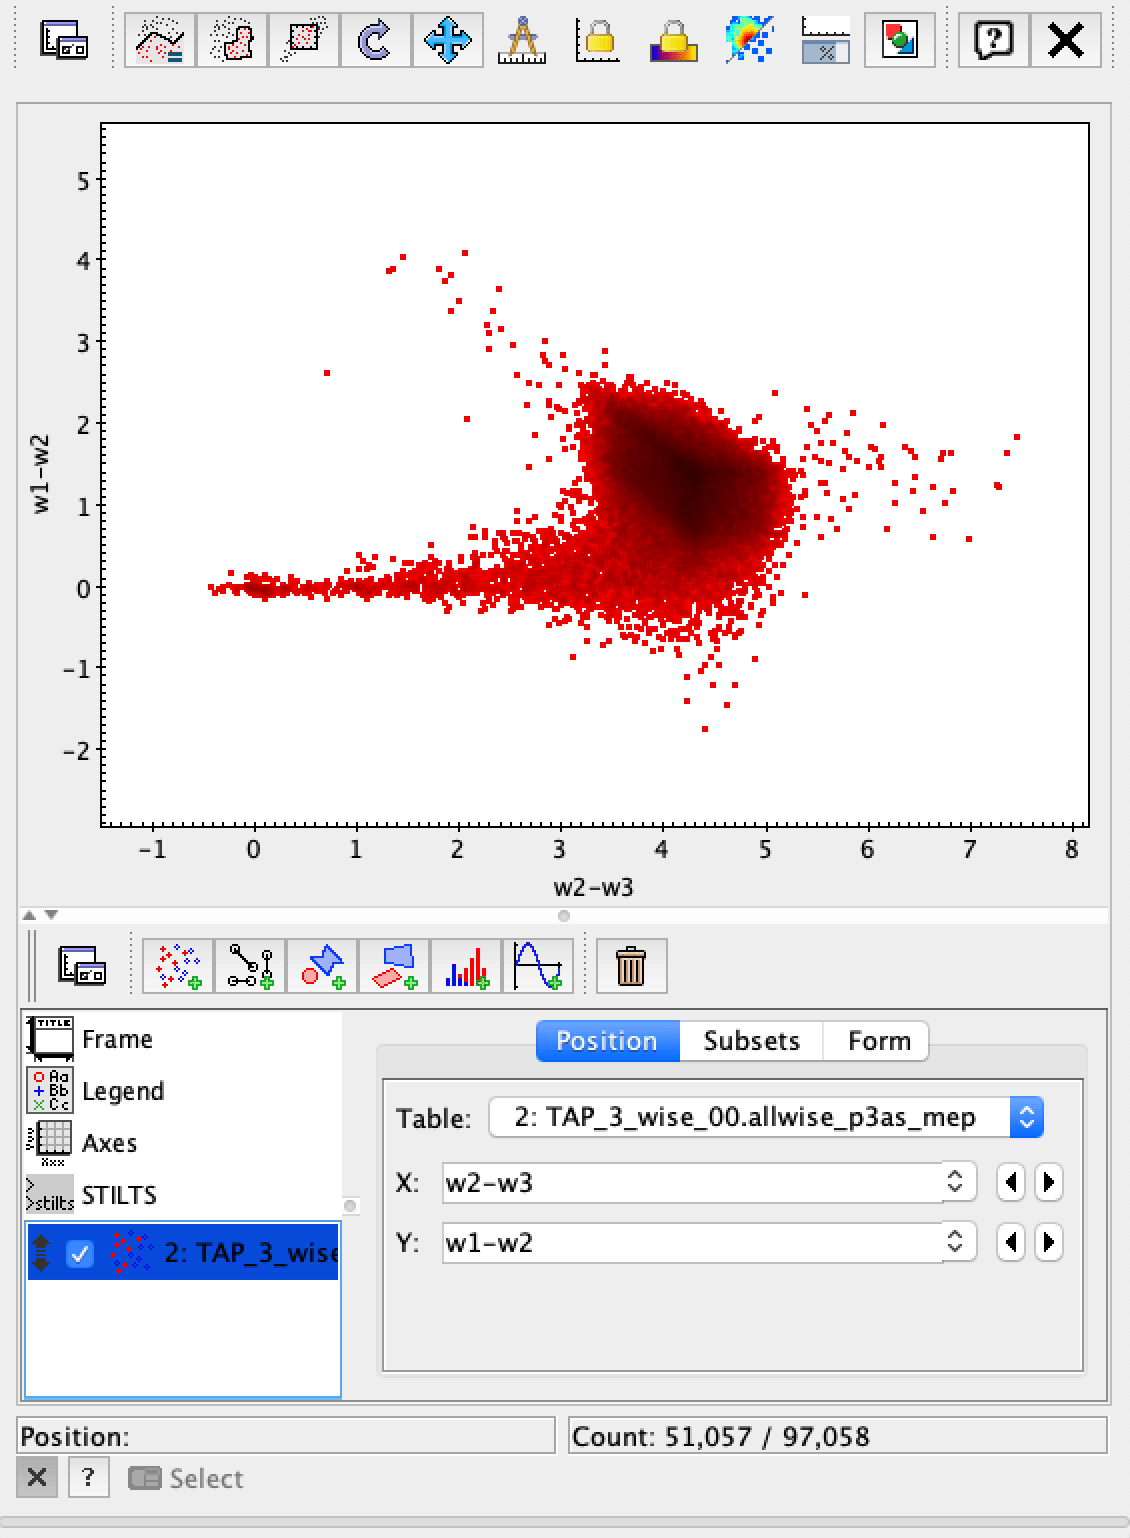
Once the query returns, you can make plots like this color-color diagram. Create two synthetic columns from the magnitude to create colors for the plot.